Analysis of the patent filings of the UK's Russell Group of Universities - Part I
This is the first of three articles examining the patent activities of the Russell Group of UK Universities.
- The first article examines the patent filings of The Russell Group of UK Universities as a whole, analysing patent growth, filing growth, international expansion of the patents worldwide
- The second article examines the patents filings of individual Universities, specifically analysing patent growth, filing growth, international expansion of the patents worldwide
- The third article examines the patent filings of individual Universities by technology classification analysis as well as citation analysis
The Russell Group of UK Universities
The Russell Group 24 members are world-class, research-intensive universities. They are unique institutions, each with their own history and ethos, but they share some distinguishing characteristics.
They are committed to maintaining the very best research, an outstanding teaching and learning experience and unrivalled links with local and national business and the public sector.
Universities included:
- University of Birmingham | University of Bristol | University of Cambridge | Cardiff University | Durham University | University of Edinburgh | University of Exeter | University of Glasgow | Imperial College London | King's College London | University of Leeds | University of Liverpool | London School of Economics | University of Manchester | Newcastle University | University of Nottingham | University of Oxford | Queen Mary University of London | Queen’s University Belfast | University of Sheffield | University of Southampton | University College London | University of Warwick | University of York
Number of patents analysed: 34,000+
Who are the Russell Group of Universities
- University of Birmingham
- University of Bristol
- University of Cambridge
- Cardiff University
- Durham University
- University of Edinburgh
- University of Exeter
- University of Glasgow
- Imperial College London
- King's College London
- University of Leeds
- University of Liverpool
- London School of Economics
- University of Manchester
- Newcastle University
- University of Nottingham
- University of Oxford
- Queen Mary University of London
- Queen’s University Belfast
- University of Sheffield
- University of Southampton
- University College London
- University of Warwick
- University of York
Russell Group universities have huge social, economic and cultural impacts locally, across the UK and around the globe:
- They produce more than two-thirds of the world-leading research produced in UK universities and support more than 300,000 jobs across the country.
- Their economic output is more than £32 billion every year.
- In 2015-16, 417,000 undergraduates and 192,500 postgraduates were studying at a Russell Group university.
Our members attract students and staff from around the world and work with major multinational businesses and international organisations:
- Thirty-nine percent of academic staff and 34% of students are of non-UK nationality, attracted to our universities by the quality, relevance and reputation of the research groups and departments they join.
Russell Group members also have a strong role and influence within their regional and local communities, collaborate with businesses on joint research projects and supply highly-qualified and highly-motivated graduates to the local workforce.
source: The Russell Group Website
More than 34,000 published patents since 2009, and more than 3,000 published each year
The Russell Group of Universities accounts for 34,060 published patents between 2009 and 2018. These include applications and granted patents. Over this period the number of published patents has seen steady annual growth - from just under 3,000 in 2009 to just under 4,000 by 2018 - an approximate growth of 30% over the decade between 2009 and 2018.
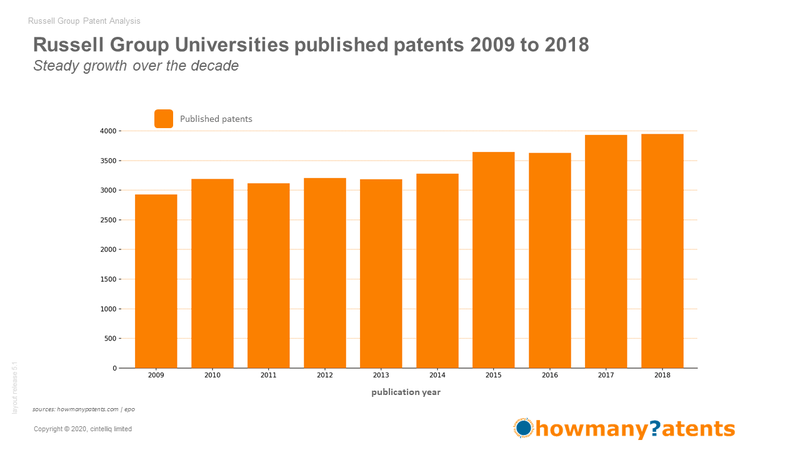
note: our analysis includes - initial publication, granted patents and corrections.
About two-thirds have been filed since 2009, with one-third were filed prior to 2009
Many of these published patents between 2009 and 2018 actually arise from patents filed prior to 2009. To show this more clearly we have highlighted those published patents filed before 2009 shown in light-grey, while those published patents filed since 2009 are highlighted in orange. Published patents with early filing initially account for a large number of the patents published at the start of the decade and gradually account for fewer published patents by the end of the decade.

It is worth noting patents published in 2018 and filed prior to 2008 are at least ten years old - and those filed even earlier may be reaching their expiration date.
note: our analysis includes - initial publication, granted patents and corrections.
The number of filed patents peak at over 3,000 between 2009 to 2012
Plotting patents by filing year shows the current published patents while only published between 2009 and 2018 actually are based on inventions initially filed many years earlier. So while we are analysing patents published between 2009 and 2018 it is important to see they have filings dates going as far back as 1988, with the most recent being in 2018. Of the published patents just over 10,000 patents were filed before 2009, and nearly 24,000 filed since 2009.
The number of filed patents see a peak between 2009 to 2012 and then gently fell from 2013 onward. This is due to the simple reason when patent applications are filed they are not published straightaway, it can take 12 or months for the application patent to be published, and several years should the patent eventually be granted.

note: our analysis includes - initial publication, granted patents and corrections.
As a group the Universities have filed more than 6,300 'separate' inventions since 2009
Published published can represent multiple "version" of the same invention - so the number of published patents will be greater than the number of unique inventions. The EPO defines these collections of patents - covering the same technical content - a patent family. The following analysis is based patent families.
To determine the number of "unique" inventions since 2009 we first select only patent families with an initial filing date on or after 2009. The published patents of these patent families are represented as dark-grey in the left-hand-side bar chart. Through the ten-year period we see the number of published patents increase year-on-year. Now if we separate out the first publication of these patent families - highlighted in orange in the right-hand-side chart, we can see a steady, almost constant, number of "unique" inventions filed each year.
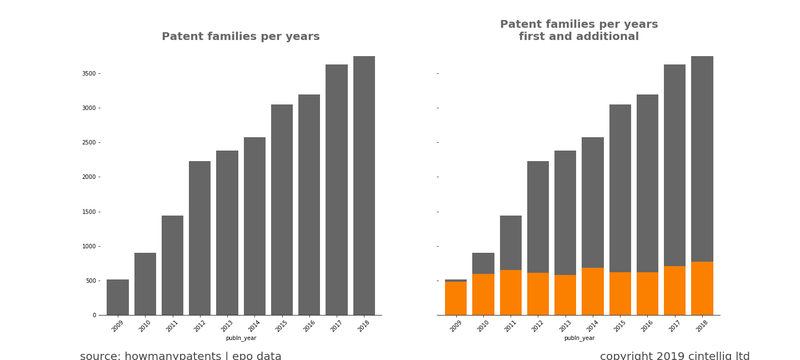
The dark-grey highlights represents the International extensions of the initial patent - the filing in other countries, and in some cases granted patents.
Part II published soon
Sign-up to receive an email when part II is published
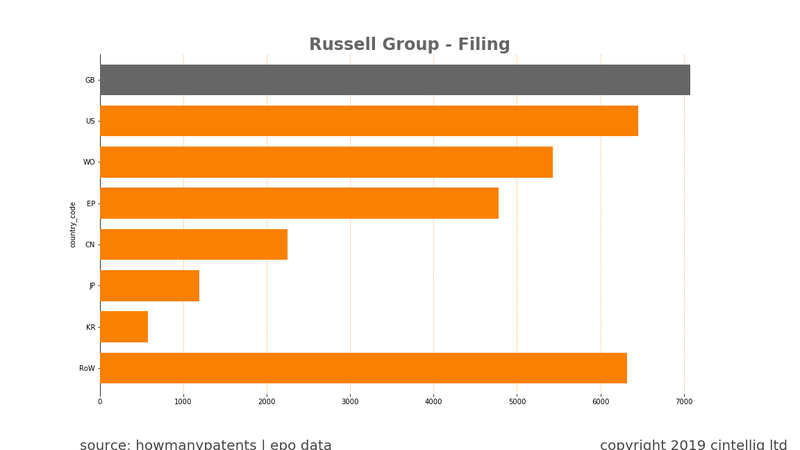
Eighty percent published in just seven regions - home country dominates filings
In terms of which countries these patent have been published in we see just over 80% have been published in seven regional patent authorities namely - GB, US, WO, EP, CN, JP, and KR - while patents filed in the rest of world (RoW) account for just under 20% of the number of published patents.
As a single authority GB filings account for the largest percentage of published patents - which is probably not too surprising given these Universities are UK based.
For those of you who are curious RoW (rest of world) and includes 57 different patent authorities or countries, these are :
- AU | CA | ES | BR | AT | DE | DK | RU | IL | MX | HK | SG
- PT | ZA | TW | NZ | EA | PL | CY | SI | IN | HU | NO | HR
- MY | AR | PH | FR | CL | PE | CO | LT | RS | UA | AP | MA
- CZ | TN | NL | ME | TR | SM | EC | UY | CR | CU | IT | SK
- EG | SA | FI | GT | IS | VN | BG | BE | SV
Analysing the patents in terms of publication country and filing year shows GB filings occurring predominantly after 2009 . This simply reflects the fact most patents are first filed in the home country - in this case GB - and are published 12 to 18 months after initially filing. The large number of patents designated WO, EP and US filed since 2009 are most likely the initial international filings of GB patents. The high number of international filings is an indication patent owners see commercial opportunities for their inventions in several of the world's key markets - The United States, China, Europe, Japan and Korea seeking to protect their intellectual property in the main key markets for their invention.

Buy the full report
The report examines in-depth the ten-year patent filing activities of
The Russell Group of Universities as a whole and the 24 individual Universities.
The report is priced at £ 3,999
You may be interested in parts II and III:
Analysis of the patent filings of the UK's Russell Group of Universities - Part II
- The second article examines the patents filings of individual Universities, specifically analysing patent growth, filing growth, international expansion of the patents worldwide
Analysis of the patent filings of the UK's Russell Group of Universities - Part III
- The third article examines the patent filings of individual Universities by technology classification analysis as well as citation analysis
Part II published soon
Sign-up to receive an email when part II is published